PostgreSQL vs Whisper, which is Faster?
Note: there is an update to this post.
TL;DR
On a 8 CPU / 16 GB EC2 instance, Tgres can process 150,000 data points per second across 300,000 series (Postgres running on the same machine). With some tweaks we were able to get the number of series to half a million, flushing ~60K data points per second.
Now the long version…
If you were to ask me whether Tgres could outperform Graphite, just a couple of months ago my answer would have been “No”. Tgres uses Postgres to store time series data, while Graphite stores data by writing to files directly, the overhead of the relational database just seemed too great.
Well, I think I’ve managed to prove myself wrong. After re-working Tgres to use the write-optimized layout, I’ve run some tests on AWS yielding unexpectedly promising results.
As a benchmark I targeted the excellent blog post by Jason Dixon describing his AWS Graphite test. My goal was to get to at least half the level of performance described therein. But it appears the combination of Go, Postgres and some clever data structuring has been able to beat it, not without breaking a little sweat, but it has.
My test was conducted on a c4.2xlarge instance, which has 8 cores and 16 GB, using 100GB EBS (which, if I understood it correctly, comes with 300 IOPS, please comment if I’m wrong). The “c4” instances are supposed to be some of the highest speed CPU AWS has to offer, but compare this with the instance used in the Graphite test, an i2.4xlarge (16 CPU/ 122GB), it had half the CPU cores and nearly one tenth of the RAM.
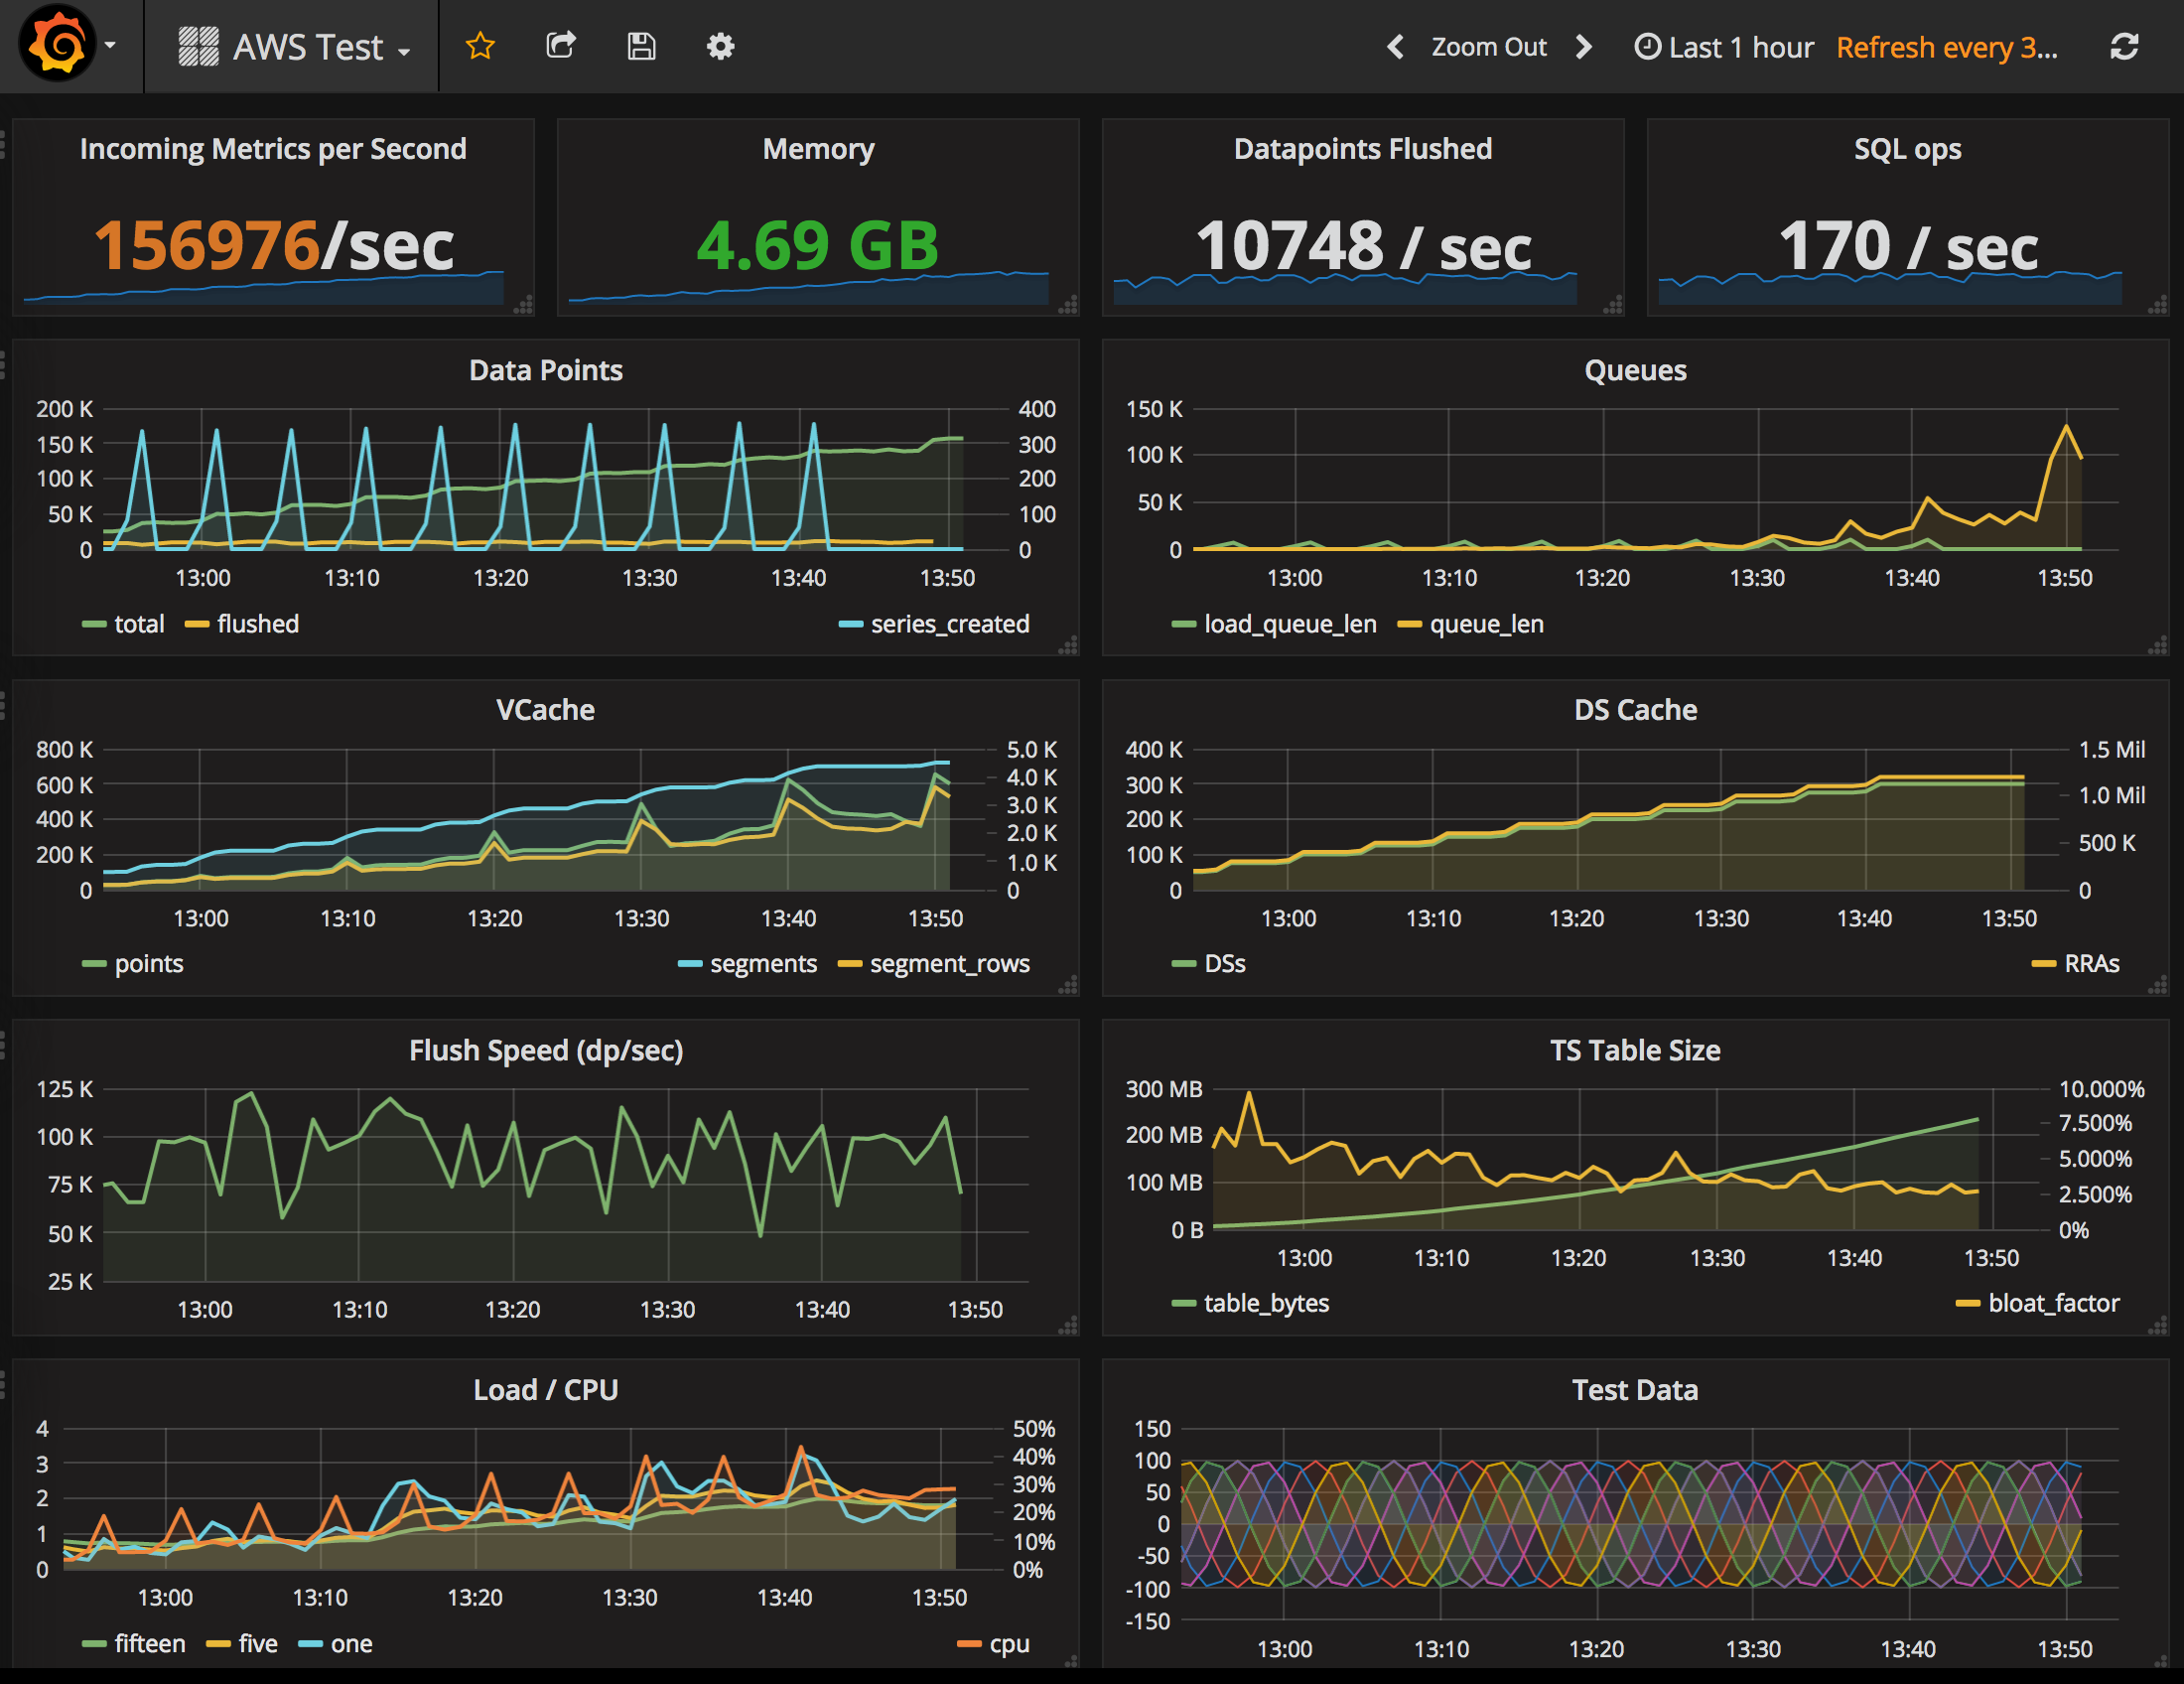
Before I go any further, here is the obligatory screenshot, then my observations and lessons learned in the process, as well as a screenshot depicting even better performance.
The Tgres version running was this one, with the config detailed at the bottom of the post.
Postgres was whatever yum install postgresql95-server brings your
way, with the data directory moved to the EBS volume formatted using
ext4 (not that I think it matters). The Postgres config was modified to
allow a 100ms commit delay and to make autovacuum extra aggressive. I
did not increase any memory buffers and left everything else as
is. Specifically, these were the changes:
autovacuum_work_mem = -1
synchronous_commit = off
commit_delay = 100000
autovacuum_max_workers = 10
autovacuum_naptime = 1s
autovacuum_vacuum_threshold = 2000
autovacuum_vacuum_scale_factor = 0.0
autovacuum_vacuum_cost_delay = 0
The data points for the test were generated by a goroutine in the Tgres process itself. In the past I’ve found that blasting a server with this many UDP packets can be tricky and hardware/network intensive. It’s also hard to tell when/if they get dropped and why, etc. Since Go is not known for having problems in its network stack, I was not too worried about it, I just wanted a reliable and configurable source of incoming packets, and in Go world writing a simple goroutine seemed like the right answer.
Somewhat Random Notes and Making Tgres Even Faster
Determining failure
Determining when we are “at capacity” is tricky. I’ve mostly looked at two factors (aside from the obvious - running out of memory/disk, becoming unresponsive, etc): receiver queue size and Postgres table bloat.
Queue size
Tgres uses “elastic channels” (so eloquently described here by Nick Patavalis) for incoming data points and to load series from Postgres. These are channel-like structures that can grow to arbitrary length only limited by the memory available. This is done so as to be able to take maximum advantage of the hardware at hand. If any of those queues starts growing out of control, we are failing. You can see in the picture that at about 140K data points per second the receiver queue started growing, though it did stay steady at this size and never spun out of control (the actual test was left overnight at this rate just to make sure).
PG Table Bloat
Table bloat is a phenomenon affecting Postgres in write-intensive situations because of its adherence to the MVCC. It basically means that pages on disk are being updated faster than the autovacuum process can keep up with them and the table starts growing out of control.
To monitor for table bloat, I used a simple formula which determined the approximate size of the table based on the row count (our data is all floats, which makes it very predictable) and compared it with the actual size. If the actual size exceeded the estimated size, that’s considered bloat. Bloat is reported in the “TS Table Size” chart. A little bloat is fine, and you can see that it stayed in fairly low percent throughout the test.
In the end, though more research is warranted, it may just turn out
that contrary to every expectation PostgreSQL was not the limiting
factor here. The postmaster processes stayed below 170MB RSS, which
is absolutely remarkable, and Grafana refreshes were very quick even
at peak loads.
Memory consumption
Tgres has a slight limitation in that creating a series is expensive. It needs to check with Postgres and for reasons I don’t want to bore you with it’s always a SELECT, optionally followed by an “UPSERT”. This takes time, and during the ramp-up period when the number of series is growing fast and lots of them need to be created, the Go runtime ends up consuming a lot of memory. You can see that screenshot image reports 4.69GB. If I were to restart Tgres (which would cause all existing DS names to be pre-cached) its memory footprint stayed at about 1.7GB. More work needs to be done to figure out what accounts for the difference.
Data Point Rate and Number of Series
The rate of data points that need to be saved to disk is a function of the number of series and the resolution of the RRAs. To illustrate, if I have one series at 1 point per second, even if I blast a million data points per second, still only 1 data point per second needs to be saved.
There is an important difference between Graphite and Tgres in that Tgres actually adjusts the final value considering the every data point value using weighted mean, while Graphite just ignores all points but the last. So Tgres does a bit more work, which adds up quickly at 6-figure rates per second.
The Graphite test if I read the chart correctly was able to process ~70K data points per second across 300K series. My test had 300K series and data points were coming in at over 150K/s. But just out of curiosity, I tried to push it to its limit.
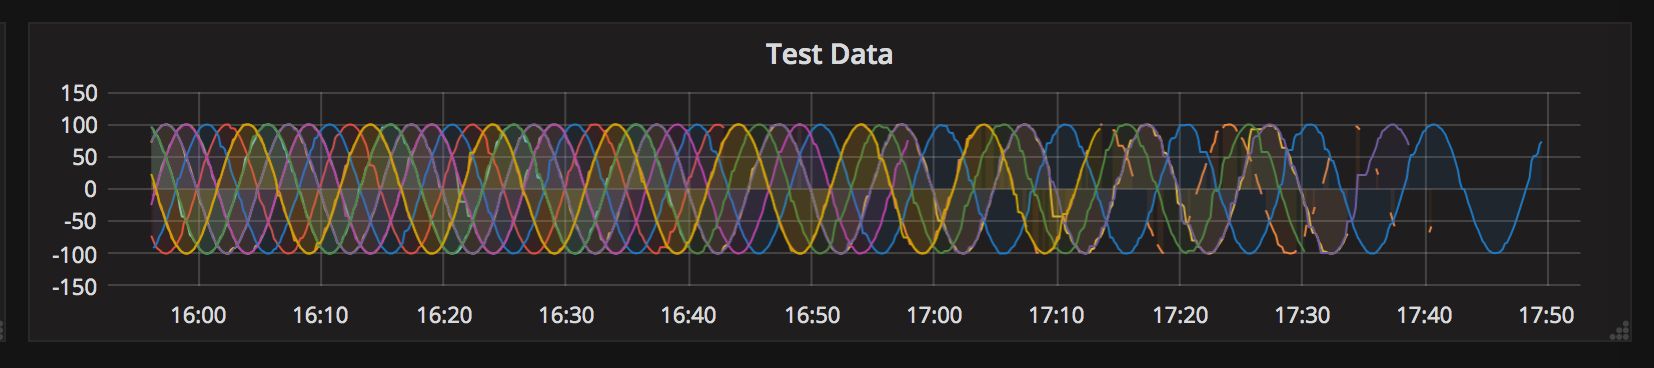
At 400 series, you can see clear signs of deterioration. You can see how vcache isn’t flushed fast enough leaving gaps at the end of series. If we stop the data blast, it does eventually catch up, so long as there is memory for the cache.
If you don’t catch this condition in time, Tgres will die with:
fatal error: runtime: out of memory

runtime stack:
runtime.throw(0xa33e5a, 0x16)
        /home/grisha/.gvm/gos/go1.8/src/runtime/panic.go:596 +0x95
...
Segment Width
There is still one easy performance card we can play here. Segment width is how many data points are stored in one row, it is also the limit on how many points we can transfer in a single SQL operation. Segment width by default is 200, because a width higher than that causes rows to exceed a page and trigger TOAST. TOAST can be good or bad because it means data is stored in a separate table (not so good), but it also means it’s compressed, which may be an I/O win.
So what would happen if we set the segment width to 1000?
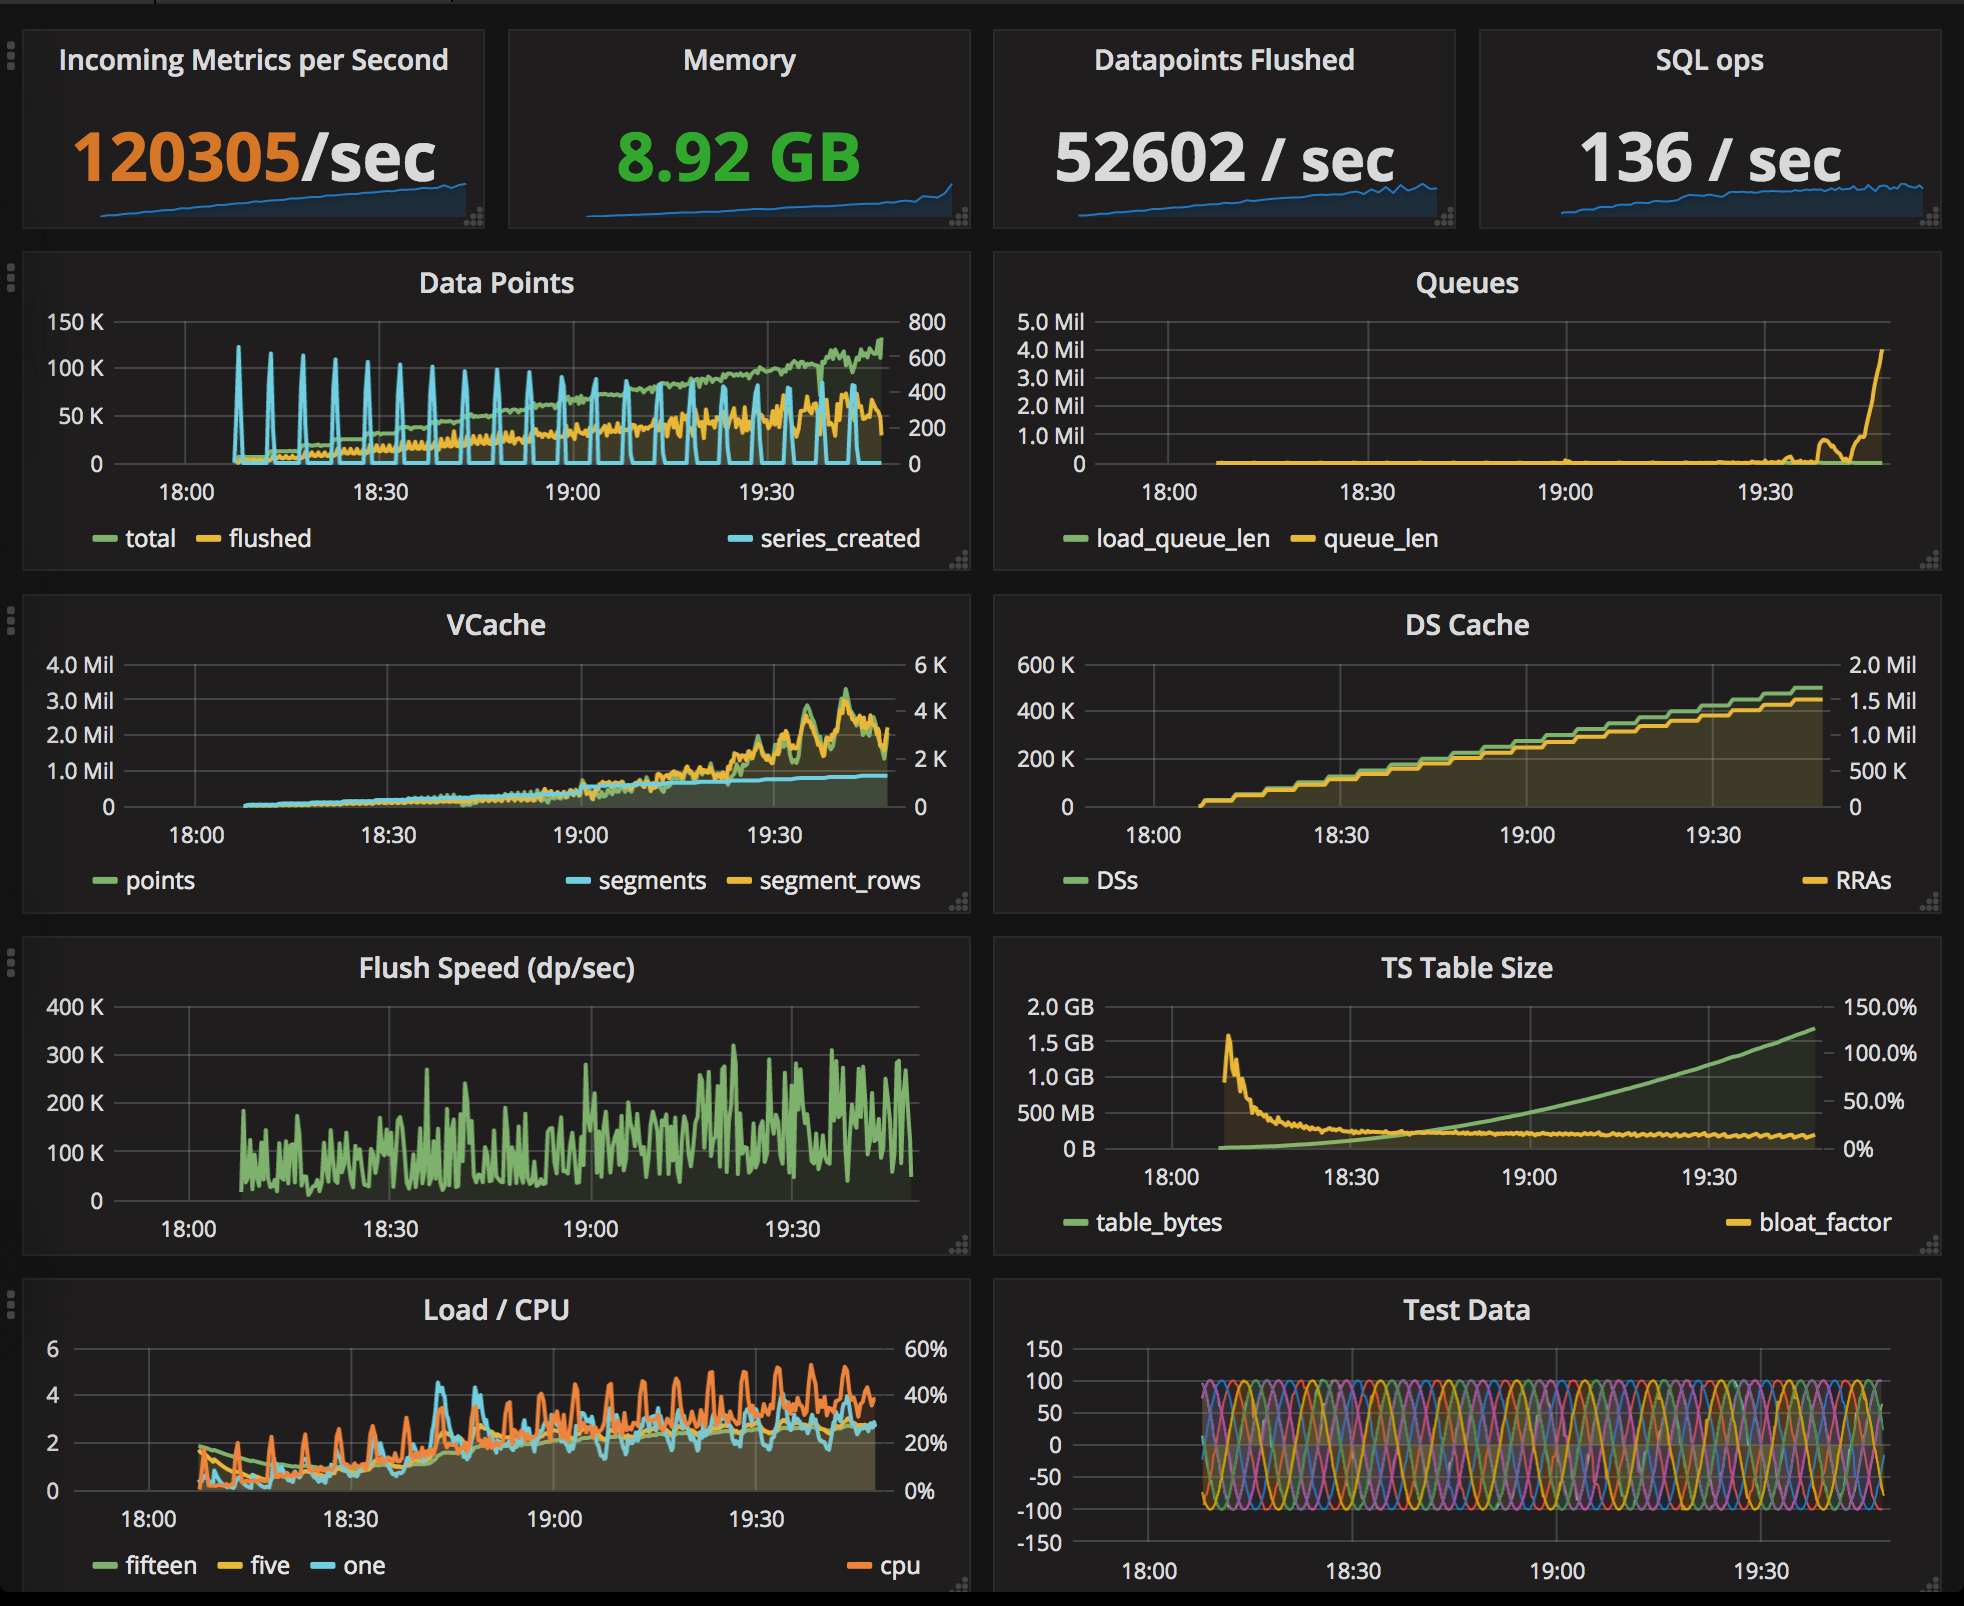
The picture changes significantly (see below). I was able to get the number of series to 500K, note the whopping 52,602 data points being written to the database per second! You can see we’re pushing it to the limit because the receiver queue is beginning to grow. I really wanted to get the rate up to 150K/sec, but it just didn’t want to go there.
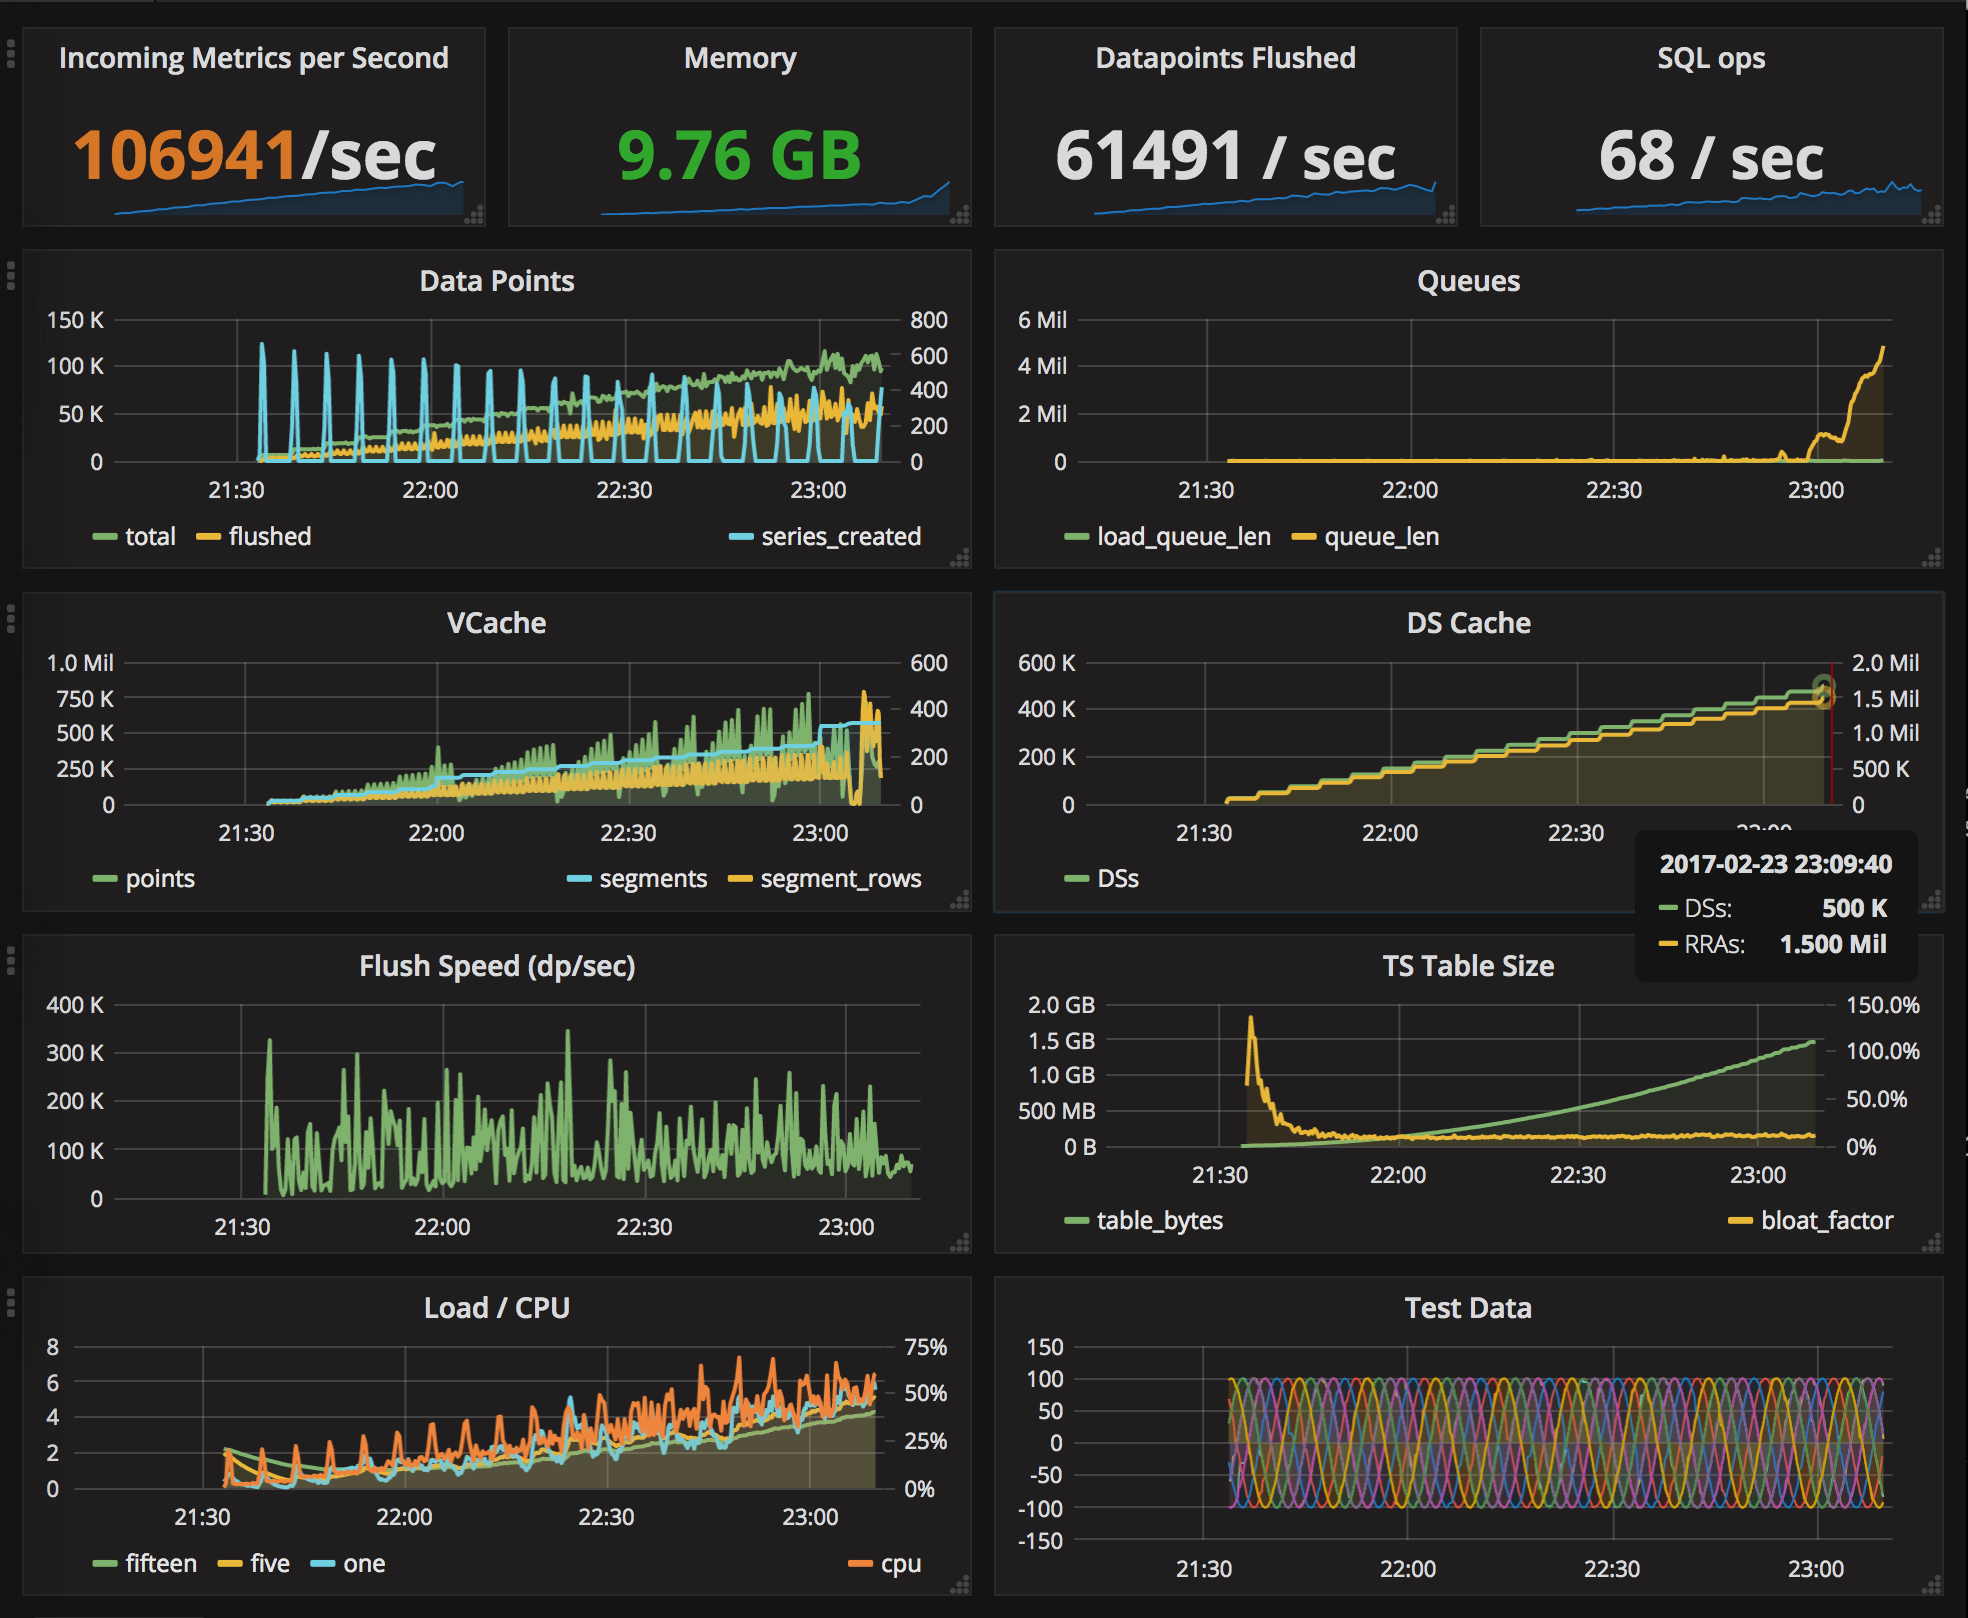
And what would happen if we set the segment width to 4096?
Interestingly, the memory footprint is a tad larger while the vcache is leaner, the number of data points flushed per second is about same, though in fewer SQL statements, and the overall picture is about the same and the incoming queue still skyrockets at just about 100K/sec over 500K series.
Conclusion
There is plenty of places in Tgres code that could still be optimized.
One issue that would be worth looking into is exposing Tgres to the firehose on an empty database. The current code runs out of memory in under a minute when suddenly exposed to 300K new series at 150K/s. Probably the simplest solution to this would be to somehow detect that we’ve unable to keep up and start dropping data points. Eventually, when all the series are created and cached, performance should even out after the initial spike and all should be well.
In any event, it’s nice to be able to do something like this and know that it is performant as well:
tgres=> select t, r from ds
 join tv  on tv.ds_id = ds.id
where ident @> '{"name":"tgres.0_0_0_0.runtime.load.five"}'
  and tv.step_ms = 10000
order by t desc
limit 5;
           t            |       r
------------------------+----------------
 2017-02-23 22:31:50+00 | 1.256833462648
 2017-02-23 22:26:30+00 | 1.305209492142
 2017-02-23 22:24:10+00 | 1.554056287975
 2017-02-23 22:24:00+00 | 1.453365774931
 2017-02-23 22:23:50+00 | 1.380504724386
(5 rows)
Reference
For completness sake, the instance was created using Terraform config approximately like this:
variable "aws_region" { default = "us-east-1" }
variable "aws_zone" { default = "us-east-1a" }
variable "key_name" { default = "REDACTED"

provider "aws" {
  region = "${var.aws_region}"
}

resource "aws_ebs_volume" "ebs_volume" {
  availability_zone = "${var.aws_zone}"
  size = 100
}

resource "aws_volume_attachment" "ebs_att" {
  device_name = "/dev/sdh"
  volume_id = "${aws_ebs_volume.ebs_volume.id}"
  instance_id = "${aws_instance.tgres-test-tmp.id}"
}

resource "aws_instance" "tgres-test-tmp" {
  ami = "ami-0b33d91d"
  instance_type = "c4.2xlarge"
  subnet_id = "REDACTED"
  vpc_security_group_ids = [
    "REDACTED"
  ]
  associate_public_ip_address = true
  key_name = "${var.key_name}"
}
And then the following commands were used to prime everyting:
sudo mke2fs /dev/sdh
sudo mkdir /ebs
sudo mount /dev/sdh /ebs

sudo yum install -y postgresql95-server
sudo service postgresql95 initdb
sudo mkdir /ebs/pg
sudo mv /var/lib/pgsql95/data /ebs/pg/data
sudo ln -s /ebs/pg/data /var/lib/pgsql95/data

sudo vi /var/lib/pgsql95/data/postgresql.conf
# BEGIN postgres config - paste this somewhere in the file
autovacuum_work_mem = -1
synchronous_commit = off
commit_delay = 100000
autovacuum_max_workers = 10
autovacuum_naptime = 1s
autovacuum_vacuum_threshold = 2000
autovacuum_vacuum_scale_factor = 0.0
autovacuum_vacuum_cost_delay = 0
# END postgres config

sudo service postgresql95 restart

# create PG database

sudo su - postgres
createuser -s ec2-user   # note -s is superuser - not necessary for tgres but just in case
createdb tgres
exit

# Tgres (requires Go - I used 1.8)
# (or you can just scp it from some machine where you already have go environment)
mkdir golang
export GOPATH=~/golang/
go get github.com/tgres/tgres
cd /home/ec2-user/golang/src/github.com/tgres/tgres
go build
cp etc/tgres.conf.sample etc/tgres.conf
The tgres.conf file looked like this:
min-step                = "10s"

pid-file =                 "tgres.pid"
log-file =                 "log/tgres.log"
log-cycle-interval =       "24h"

max-flushes-per-second      = 1000000 # NB - Deprecated setting
workers                     = 4       # NB - Deprecated setting

http-listen-spec            = "0.0.0.0:8888"
graphite-line-listen-spec   = "0.0.0.0:2003"
graphite-text-listen-spec   = "0.0.0.0:2003"
graphite-udp-listen-spec    = "0.0.0.0:2003"
graphite-pickle-listen-spec = "0.0.0.0:2004"

statsd-text-listen-spec     = "0.0.0.0:8125"
statsd-udp-listen-spec      = "0.0.0.0:8125"
stat-flush-interval         = "10s"
stats-name-prefix           = "stats"

db-connect-string = "host=/tmp dbname=tgres sslmode=disable"

[[ds]]
regexp = ".*"
step = "10s"
#heartbeat = "2h"
rras = ["10s:6h", "1m:7d", "1h:1y"]
Tgres was running with the following. The TGRES_BLASTER starts the
blaster goroutine.
TGRES_BIND=0.0.0.0 TGRES_BLASTER=1 ./tgres
Once you have Tgres with the blaster running, you can control it via HTTP, e.g. the following would set it to 50K/s data points across 100K series. Setting rate to 0 pauses it.
curl -v "http://127.0.0.1:8888/blaster/set?rate=50000&n=100000"