Simple Tgres Part II - A High Rate Counter
Continuing on the the previous post on simple use of Tgres components, let’s try to count something that goes by really fast.
This time let’s start out with creating a memory-based SerDe. This means that all our data is in memory and there is no database backing our series.
package main

import (
    "fmt"
    "net/http"
    "time"

    "github.com/tgres/tgres/dsl"
    h "github.com/tgres/tgres/http"
    "github.com/tgres/tgres/receiver"
    "github.com/tgres/tgres/rrd"
    "github.com/tgres/tgres/serde"
)

func main() {

    step := 1 * time.Second // 1 second resolution
    span := 600 * step      // spanning 10 minutes

    // In-memory SerDe
    ms := serde.NewMemSerDe()

    // Create a receiver of our data points backed by the above
    // memory SerDe
    rcvr := receiver.New(ms, &receiver.SimpleDSFinder{&rrd.DSSpec{
        Step: step,
        RRAs: []rrd.RRASpec{
            rrd.RRASpec{Function: rrd.WMEAN,
                Step: step,
                Span: span,
            },
        }}})
    rcvr.Start()
Now let’s create a goroutine which creates data points as fast as it can, the difference from the previous blog post is that we are using QueueGauge(), which is a paced metric, meaning that it flushes to the time series only periodically (once per second by default) so as to not overwhelm the I/O and or network (even though in this case it doesn’t really matter since we’re using a memory-based SerDe anyway).
    start := time.Now()
    end := start.Add(span)

    go func() {
        n := 0
        for t := time.Now(); t.Before(end); t = time.Now() {
            rcvr.QueueGauge(serde.Ident{"name":"foo.bar"}, float64(n)/(t.Sub(start)).Seconds())
            n++
        }
    }()
And finally, as before, we need to hook up a couple of http handlers:
    db := dsl.NewNamedDSFetcher(ms.Fetcher())

    http.HandleFunc("/metrics/find", h.GraphiteMetricsFindHandler(db))
    http.HandleFunc("/render", h.GraphiteRenderHandler(db))

    listenSpec := ":8088"
    fmt.Printf("Waiting for requests on %s\n", listenSpec)
    http.ListenAndServe(listenSpec, nil)

} // end of main()
Now if we run the above code with something like
go run simpletgres.go, we’ll notice that unlike with the previous
example, the web server starts right away, and the data points are
being written while the server is running. If we aim Grafana at it,
we should be able to see the chart update in real time.
After a couple of minutes, mine looks like this:
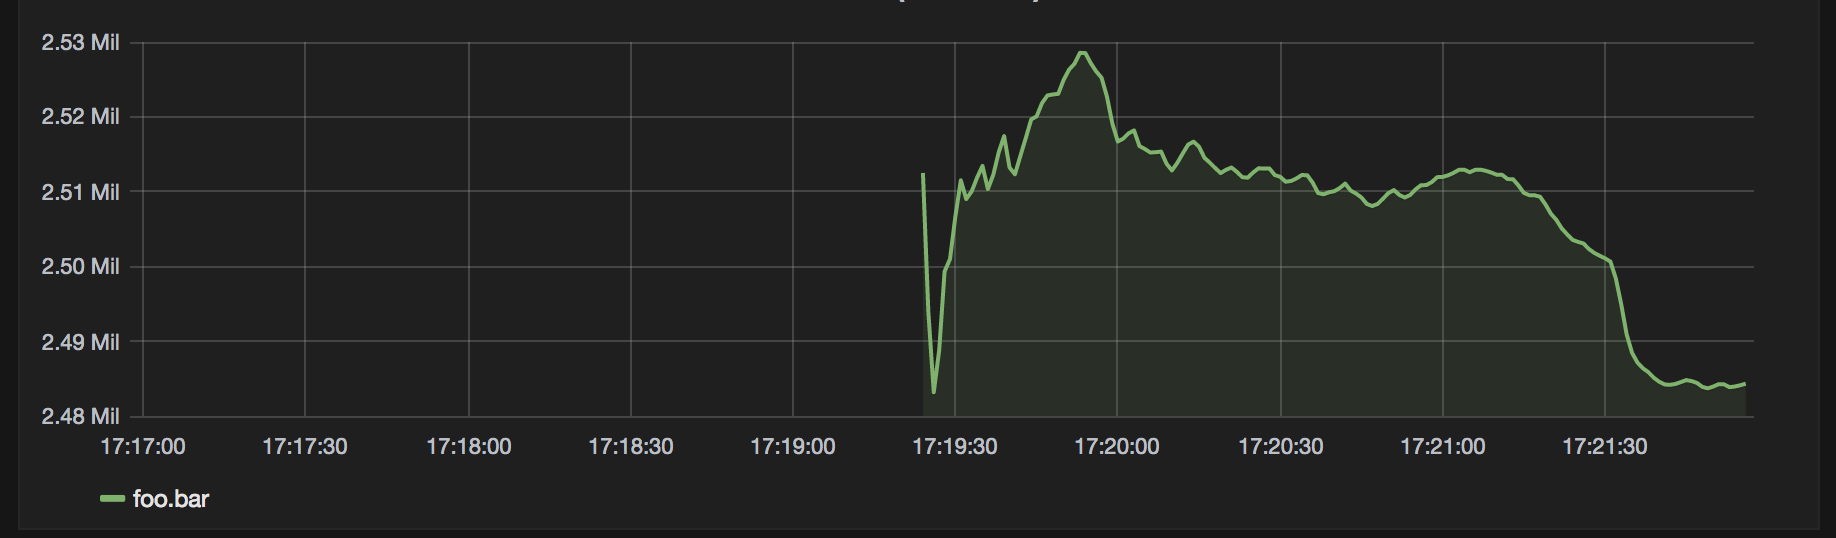
So my macbook can crank these out at about 2.5 million per second.
In my experience instrumenting my apps with simple counters like this and having them available directly from the app without having to send them to a separate statsd server somewhere has been extremely useful in helping understand performance and other issues.