Simple Time Series App with Tgres
Did you know you can use Tgres components in your code without PostgreSQL, and in just a dozen lines of code instrument your program with a time series. This example shows a complete server emulating Graphite API which you can use with Grafana (or any other tool).
In this example we will be using three Tgres packages like so (in addition to a few standard ones, I’m skipping them here for brevity - complete source code gist):
import (
    "github.com/tgres/tgres/dsl"
    h "github.com/tgres/tgres/http"
    "github.com/tgres/tgres/rrd"
)
First we need a Data Source. This will create a Data Source containing one Round Robin Archive with a 10 second resolution spanning 1000 seconds.
step := 10 * time.Second
span := 100 * step

ds := rrd.NewDataSource(rrd.DSSpec{
    Step: 1 * time.Second,
    RRAs: []rrd.RRASpec{
        rrd.RRASpec{Step: step, Span: span},
    },
})
Let’s shove a bunch of data points into it. To make it look extra nice, we can make these points look like a sinusoid with this little function:
func sinTime(t time.Time, span time.Duration) float64 {
    x := 2 * math.Pi / span.Seconds() * float64(t.Unix()%(span.Nanoseconds()/1e9))
    return math.Sin(x)
}
And now for the actual population of the series:
start := time.Now().Add(-span)

for i := 0; i < int(span/step); i++ {
    t := start.Add(time.Duration(i) * step)
    ds.ProcessDataPoint(sinTime(t, span), t)
}
We will also need to create a NamedDSFetcher, the structure which knows how to search dot-separated series names a la Graphite.
db := dsl.NewNamedDSFetcherMap(map[string]rrd.DataSourcer{"foo.bar": ds})
Finally, we need to create two http handlers which will mimic a Graphite server and start listening for requests:
http.HandleFunc("/metrics/find", h.GraphiteMetricsFindHandler(db))
http.HandleFunc("/render", h.GraphiteRenderHandler(db))

listenSpec := ":8088"
fmt.Printf("Waiting for requests on %s\n", listenSpec)
http.ListenAndServe(listenSpec, nil)
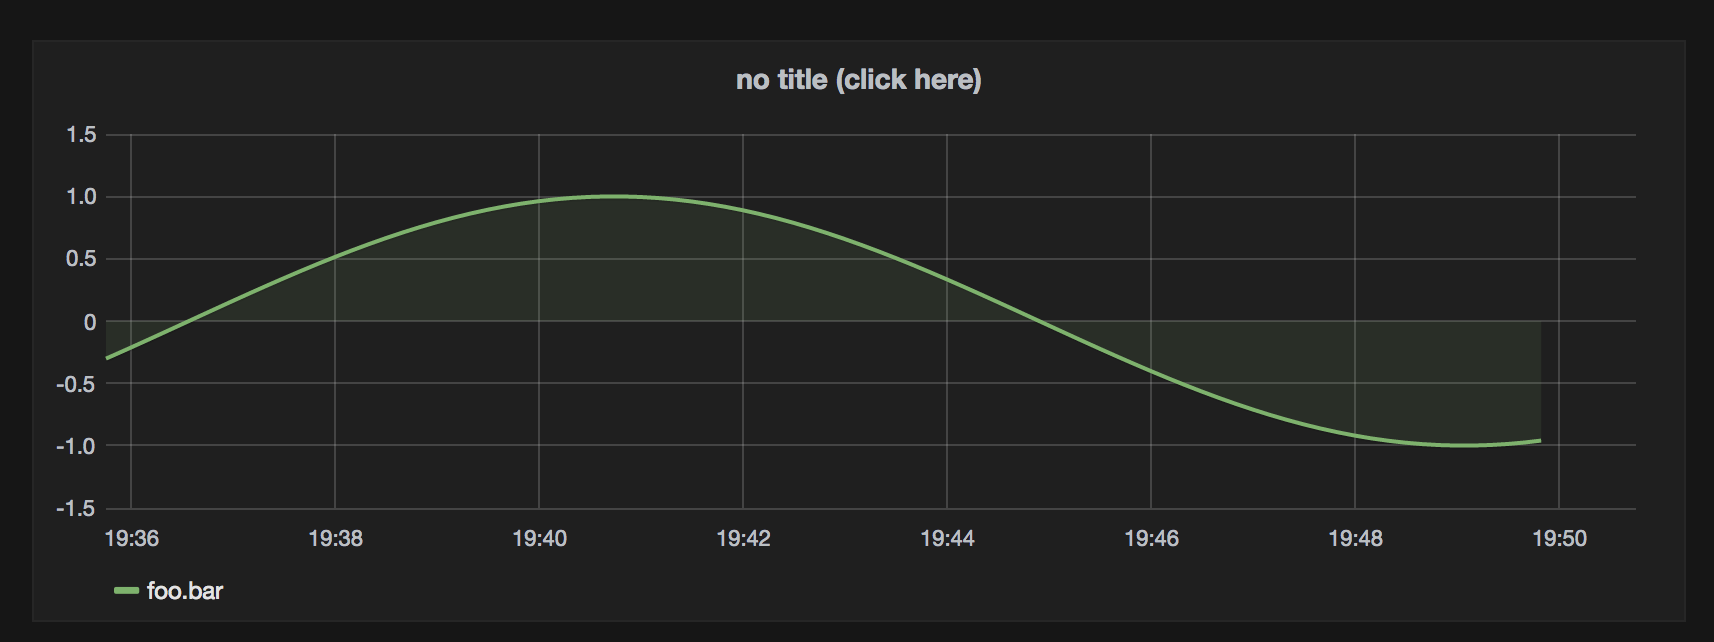
Now if you point Grafana at it, it will happily think it’s Graphite and should show you a chart like this:

Note that you can use all kinds of Graphite functions at this point - it all “just works”.
Enjoy!